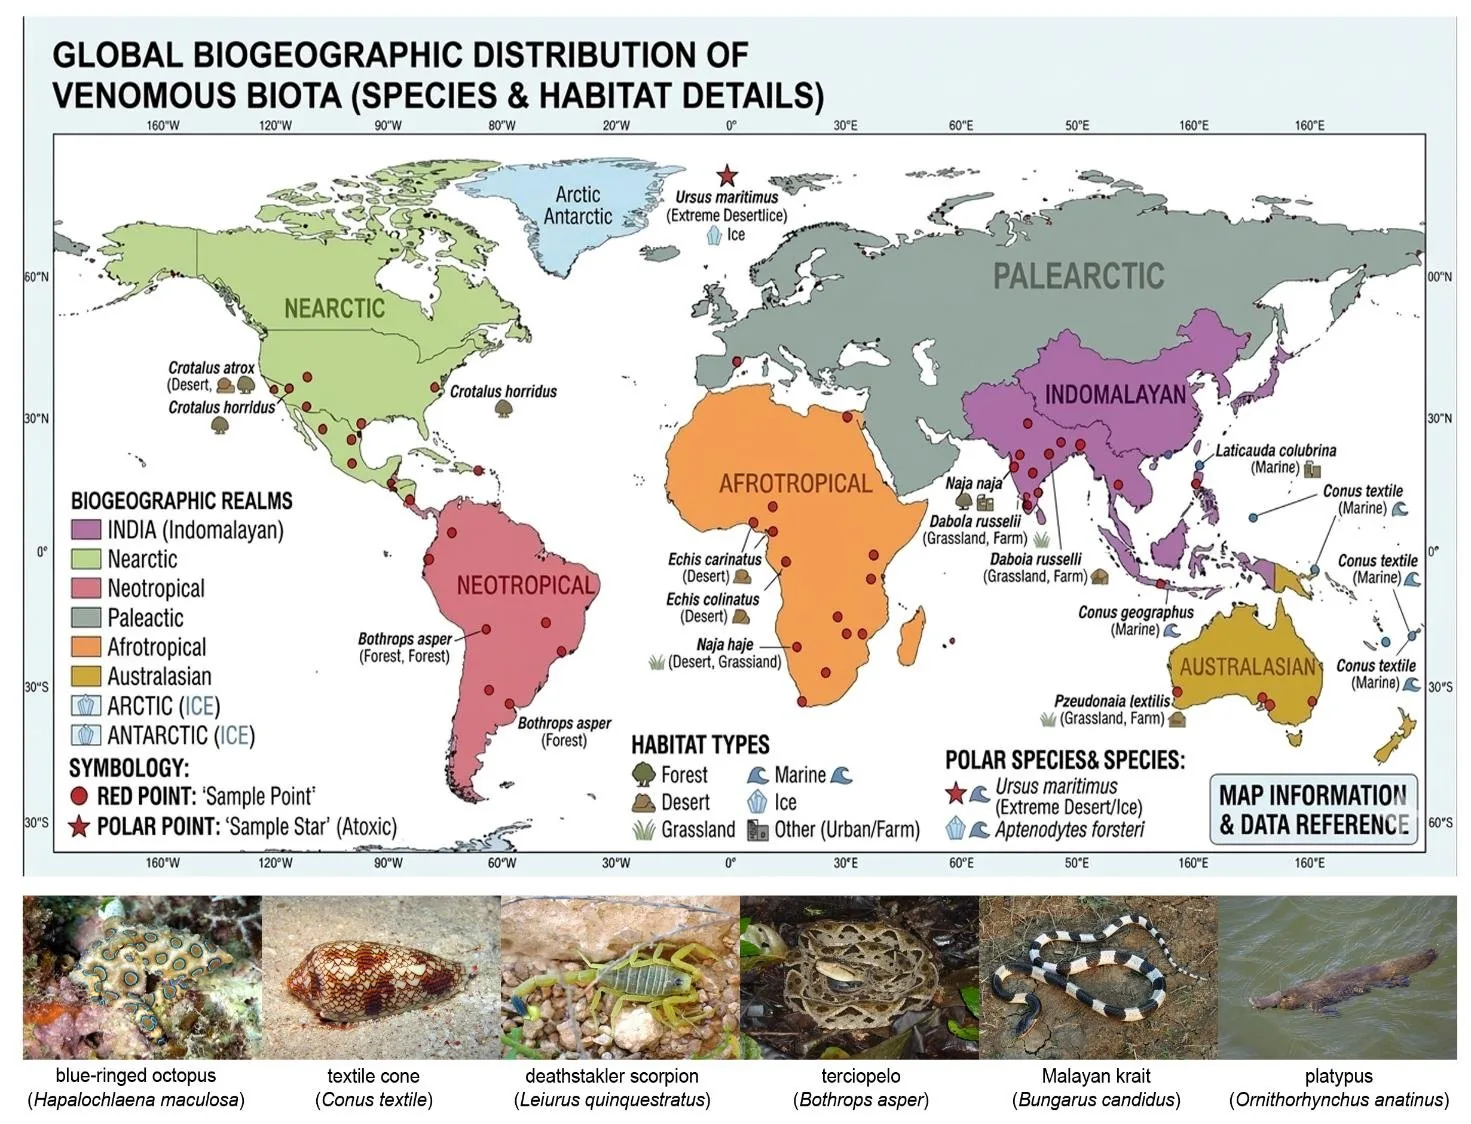
World map showing the global biogeography of venomous species
Global biogeography of venomous species · from the comparative dataset

Research & Making

Following questions through data and making.

My research and technical work examine animals, environmental risk, and the methods we use to describe complex systems.

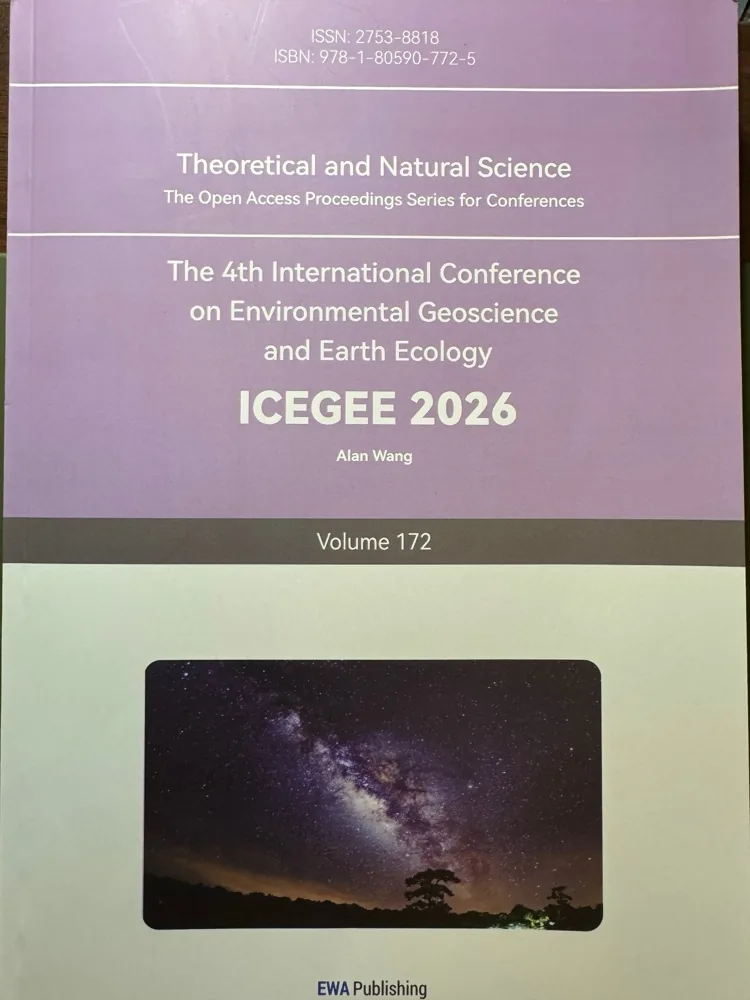
Cover of the Theoretical and Natural Science proceedings volume for ICEGEE 2026
Proceedings cover — Theoretical and Natural Science Vol. 172, ICEGEE 2026
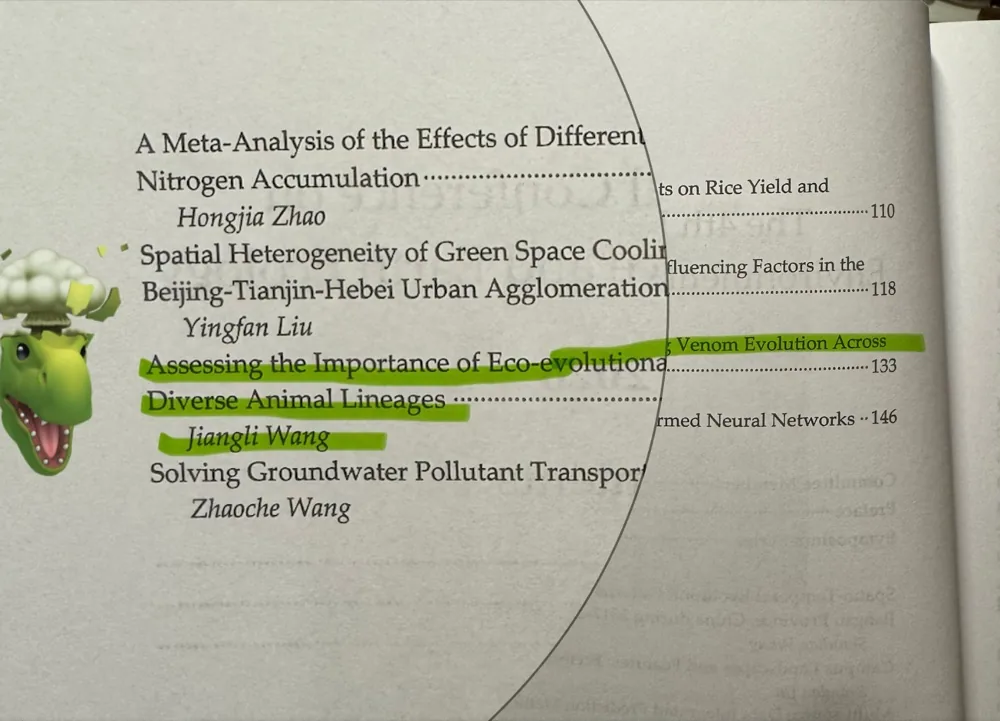
Table of contents page listing the venom evolution paper
The paper as listed in the proceedings table of contents
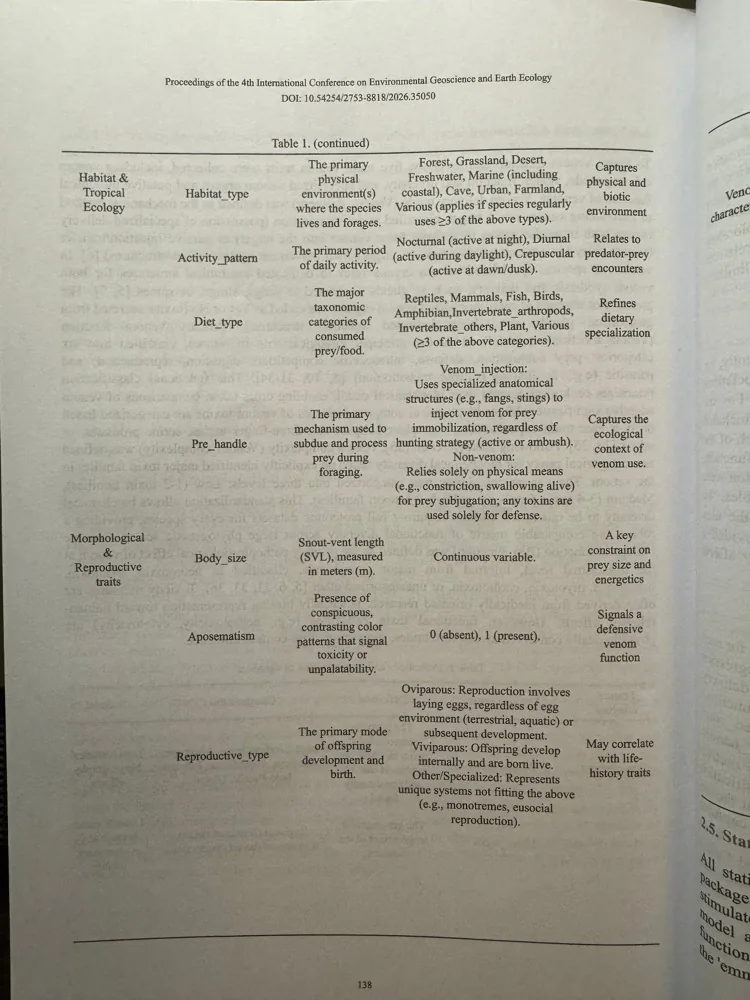
A variable-definition table printed in the paper
A variable-definition table from the paper

01 · Research · Ecology · Evolution

Venom Across Animal Lineages

Scientific Researcher & Dataset Architect

Question

Which ecological variables are associated with differences in venom traits across animal groups?

  • Dataset: 125 species · 11 animal groups · 9 ecological factors · 5 venom traits
  • Methods: random forests (tree-based ensemble models) and generalized linear models (regression models for varied data types)

I compiled a comparative dataset covering 125 species across 11 animal groups, recording nine ecological factors and five venom traits for each. Random-forest and generalized-linear analyses then examined how body size, habitat, prey handling, and diet relate to venom traits.

Findings

Within this dataset, body size, habitat, and prey handling showed stronger associations with venom traits than diet. This is an association study, not a causal proof, and not a rule that generalizes to all animals.

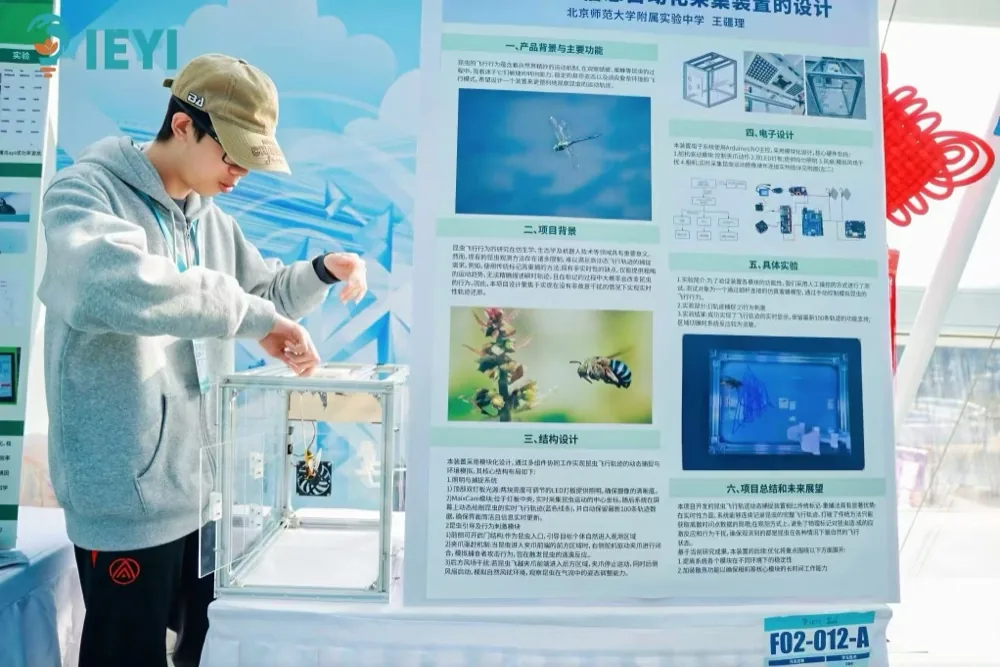
Presenting a project poster at the International Exhibition for Young Inventors
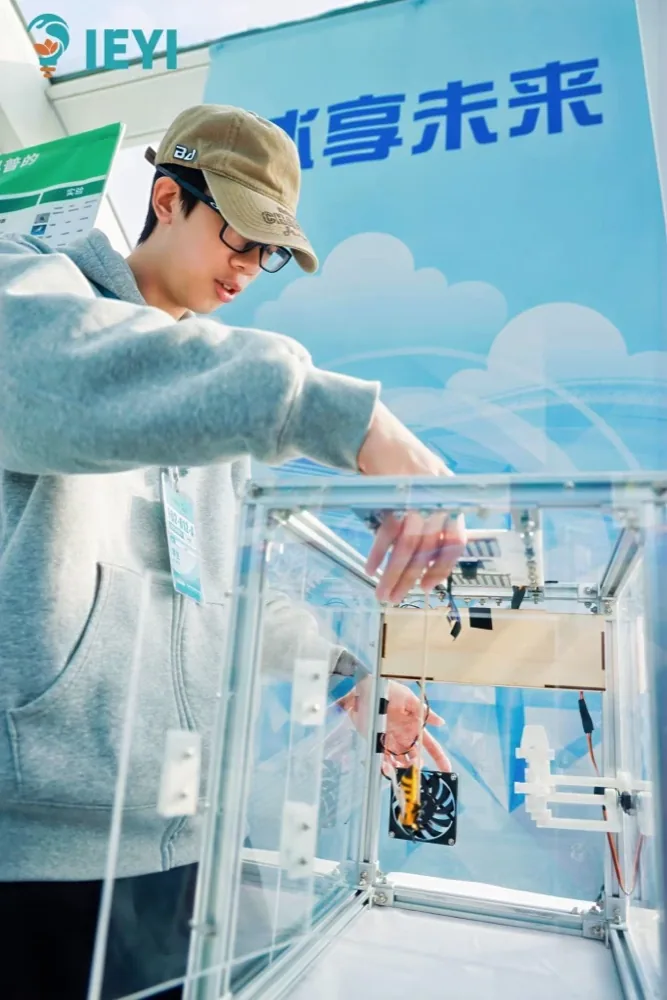
Hands adjusting an exhibit device at the IEYI venue
Presenting at the International Exhibition for Young Inventors (IEYI) · Fine-tuning the exhibit device at the IEYI venue

02 · Engineering · Behaviour

Insect Behavior Detection System

Tech Designer & Creative Maker

  • Built, coded, and tested an Arduino imaging system.
  • Filmed 50+ species, tracked wing motion, compared flight patterns.
  • Explored a robotic tool for biodiversity surveillance and ecological monitoring.

I designed and assembled an Arduino-based imaging system, wrote the code that drove it, and used it to film more than fifty insect species. Recording wing motion frame by frame made it possible to compare flight patterns across species.

Findings

Recognition: Distinction (Top 10%), International Exhibition for Young Inventors. The system remains a research prototype — an exploration, not a monitoring product in field use.

Certificate of completion from the UC Davis pre-college program
UC Davis · certificate of completion

03 · Environmental Science

Environmental Toxicology — UC Davis Honey Bee Lab

Student researcher, pre-college program

  • Investigated pesticide exposure in honey bees.
  • Tracked a growth/lifespan-related marker; reported expression fell to 19% of controls.
  • Output: 8-page report.

In a university honey bee lab, I investigated how pesticide exposure affects honey bees, tracking a growth- and lifespan-related marker. In the treated groups, reported marker expression fell to 19% of the control level.

Findings

The 19% figure refers to marker expression only — not to colony survival, overall lifespan, or mortality.

Editorial illustration of a city skyline read through measurement lines and ranking charts
Illustration · reading a city through data

04 · Data · Urban Systems

Urban Sustainability Assessment

Program Lead for Urban Sustainability Research

  • Built a RAG-based model (retrieval-augmented generation) using policy reports.
  • Assessed 15 cities using 12 criteria.
  • Reported rank reversals fell from 45.2% to 11.5% in the tested assessment.

I led a project that built a retrieval-augmented generation (RAG) model grounded in policy reports, then used it to assess fifteen cities against twelve sustainability criteria. In the tested assessment, rank reversals — the same city receiving inconsistent rankings across runs — fell from 45.2% to 11.5%.

Findings

This improvement is specific to the tested assessment. It is not a claim of overall accuracy improvement, and not a claim that all bias was eliminated.

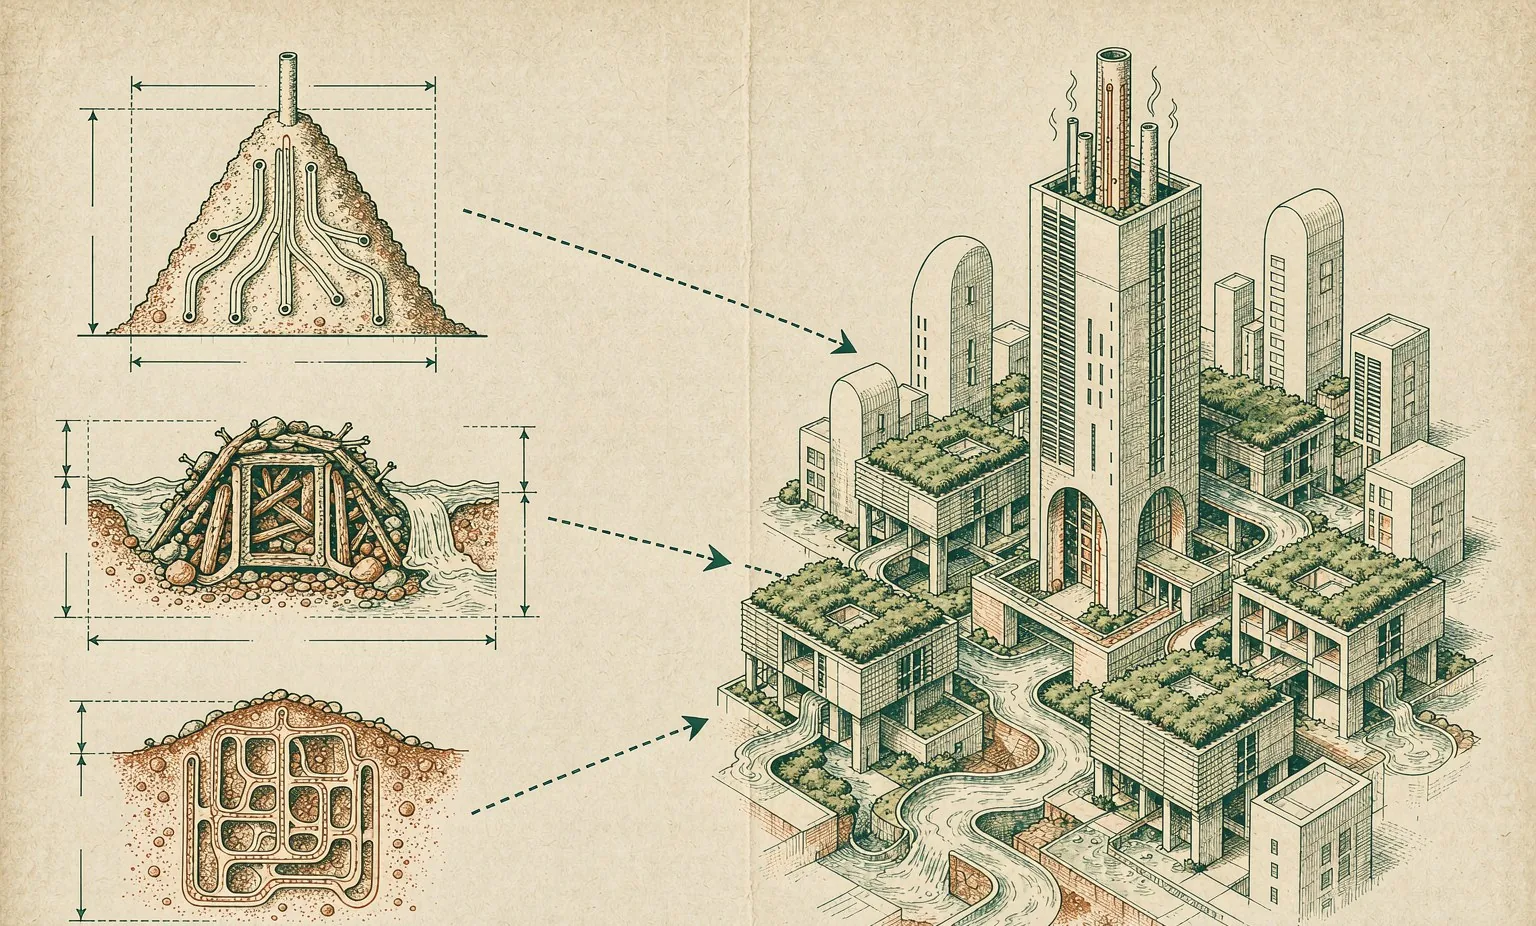
Editorial illustration of termite mounds, beaver dams, and ant trails flowing into a climate-resilient city
Illustration · lessons from animal builders

05 · Published Analysis

Learning from Animal Builders

Author

  • Explored termite cooling, beaver flood control, and ant traffic logic as models for climate-resilient urban design.

A published analysis of what termite mounds, beaver dams, and ant traffic can teach climate-resilient urban design. The article is an exploration of ideas — no buildings, flood facilities, or traffic systems were constructed.

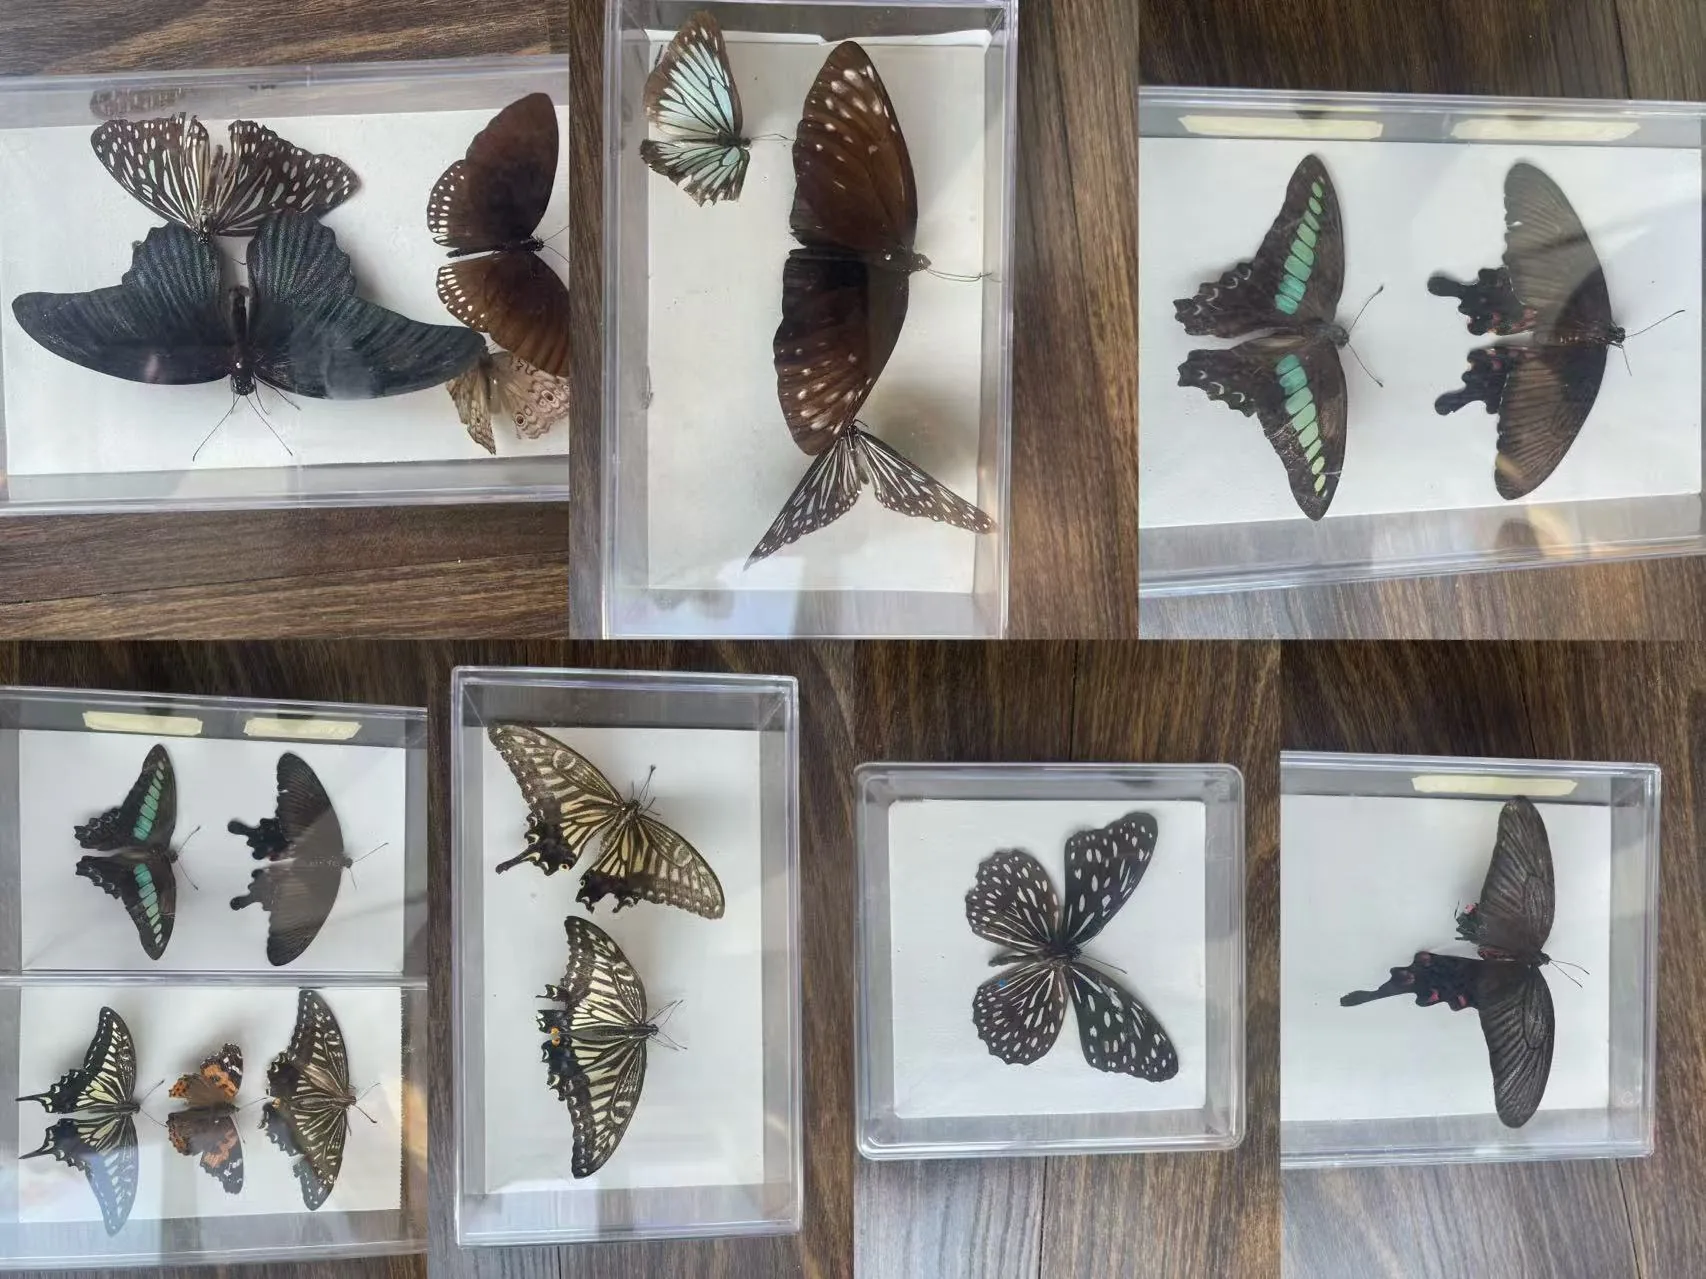
Framed butterfly specimens in a wooden case
Pollinator specimens · project reference set

06 · Collaborative Program

Pollinator & Insect-Hotel Project

Participant, Stanford U.S.–China Co-Lab on Climate Solutions

  • Researched climate threats to pollinators.
  • Designed and built shelters for bees, ladybugs, and lacewings.
  • Wrote care guides.

Through a collaborative program on climate solutions, I researched the climate threats pollinators face, then designed and built shelters for bees, ladybugs, and lacewings, and wrote care guides for maintaining them.

Findings

This was a course-based collaborative project, not a formal research appointment; no ecological outcomes are quantified here.